Can an aeroplane land where it has never been?
Half yes, and the half that fails is measured. One system on an embedded module, with no satellite fix and no radio aid at the field: the same 162 deliberately wrong starts have now been flown twice, by two versions, and scored identically. Lining up is solved — 4.2 m from the centreline from any starting offset, and it does not matter whether the system has seen the airfield. Landing is not: from 1.5 nm it touches down on the threshold, from 2.5 nm it still lands 160 m short. Every number is here, including the ones that look bad — and two of them are bad in ways worth the space: a baseline trained in 48 seconds reaches the runway more often than this does, and when all three were then asked to land on a carrier deck, all three failed. Getting there in the first place — the leg, with no satellite fix — is a report of its own.
Satellite navigation is the softest part of the stack
Jamming and spoofing are routine now, and they have made satellite navigation the most easily removed component an aircraft carries. The approach is where losing it hurts most: it is the phase with the least height, the least time and the least margin, and the phase most dependent on knowing precisely where the aircraft is relative to one particular piece of ground.
The usual answer is a ground aid — an instrument landing system, a beacon, a beam. That answer assumes the destination is equipped and cooperating. A diversion field, an austere strip or a damaged airport is none of those things, and it is exactly where an aircraft ends up when the primary plan has already failed.
So this work asks two questions, in the narrowest testable form I could put them in:
- With no satellite fix at all, can an aircraft establish where it is accurately enough, over a leg long enough to matter, to hand a runway to an approach?
- With no ground aid at the field, and at a field the system has never seen, can it then fly itself onto that runway?
Both are questions about assurance rather than capability. One successful approach answers neither. What answers them is a measured envelope: how far wrong the aircraft can start, how far wrong it ends up, and the conditions under which it stops working altogether. That is what the rest of this page reports, including the parts that do not work.
What it was denied
A result is worth something in proportion to how little the system was given. Every constraint below was chosen deliberately, and each one is a thing a reader is entitled to assume was not quietly relaxed to make the numbers come out.
- No satellite fix
- No GNSS position at any point of the approach. Not degraded, not intermittent — absent.
- No ground aid
- No ILS, no beacon, no beam, no differential correction, nothing transmitted from the destination. The field is assumed uncooperative.
- No exotic sensor
- What the aircraft can see out of the window, and what it already knows about its own state. No lidar, no radar altimeter, no survey-grade inertial unit.
- The most ordinary aeroplane there is
- Cessna 172 — a four-seat single-engine light aeroplane. Nothing here rests on an exotic airframe, a bespoke sensor or a research platform nobody else can get hold of.
- Compute that could fly
- Every decision on this page was made on a standalone embedded module, not on the desktop machine running the simulation.
- Airfields it had not seen
- Two of the three runway ends were held out entirely. Results are reported per runway end and never blended into one number.
- Deliberately wrong starts
- The system was not handed a good approach to finish. It was started up to 400 m to one side and 300 ft off height, 162 times, one error at a time.
- One attempt each
- A go-around ends the approach and scores as a failure to recover. Nothing was re-flown for a better result.
What was not denied is set out under “what this is not”: this is simulation, the module is fed a rendered view of the world, and the imagery flown comes from the same source as the imagery the system refers to. Those are the three places this rig is kinder than reality.
Watch it fly
Rendered from the recorded trajectory. The runway the system is tracking is boxed as it tracks it, the panel carries live distance, height, speed, sink and error from the centreline, and every decision the system takes is listed as it takes it — including the ones it reverses.
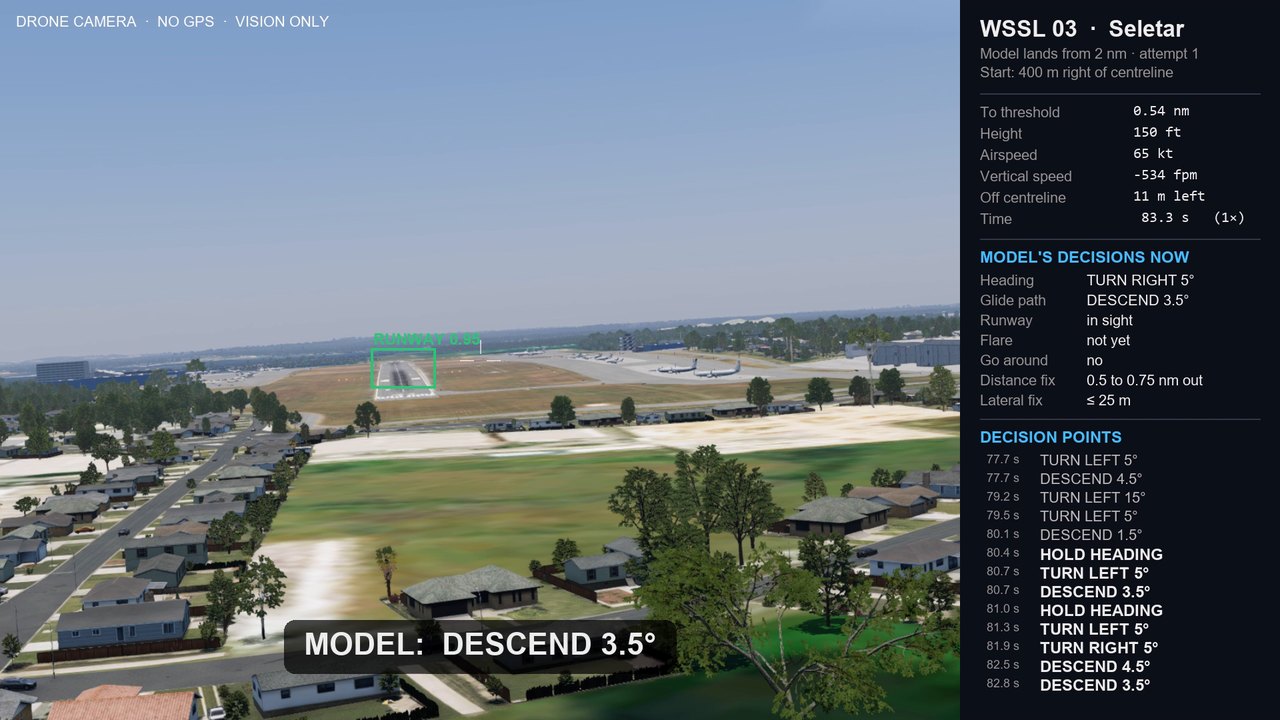
Two versions, the same 162 starts
The previous version of this page said the aircraft lined up and would not land. That is no longer true, and the table below is the whole argument for why a measured envelope is worth the trouble: it said exactly where to look, and the next version fixed most of it. Both versions flew the identical 162 starts and were scored the same way, so every comparison on this page is like for like, and the older figures are kept beside the new ones.
| previous | current | |
|---|---|---|
| Reached the runway | 18 | 47 |
| On the aim point | 5 | 10 |
| Touched down off the side of the runway | 37 | 1 |
| Gave up (go-around) | 23 | 17 |
| Median error from the centreline | 16.6 m | 4.2 m |
| Flared, of those that touched down | 55 of 139 | 118 of 145 |
| Median sink at touchdown | 341 fpm | 195 fpm |
| Median touchdown past the threshold | −157 m | −145 m |
From where can it actually recover?
A demo answers “does it work?” An envelope answers the question an operator actually has: from how far wrong can this thing recover, and at what point does it give up? So the system was started deliberately wrong — 162 times, one error at a time, at three ranges from the runway, from up to 400 m to either side and up to 300 ft off the correct height. Then the whole matrix was flown again, unchanged, by the newer version. The charts below are the newer one.
Started off to the sideGo-arounds
Started off the correct heightGo-arounds
Distance out at the startGo-arounds
Where it actually touches down
Side to side: solved
Started anywhere from on the centreline to 400 m beside it, the aircraft now arrives within 2.7 to 5.7 m of the centreline — the starting error still has essentially no effect on where it ends up, but the error itself has come down by a factor of four. Touchdowns off the side of the runway went from 37 to 1.
The bias that was visible before is still there, and still systematic: 118 of 145 touchdowns landed left of the centreline, in the steady 8 kt crosswind from the right that every start was flown in. It is now a 4 m offset, down from 17 m. A systematic error is a far better problem to have than random scatter, because one correction can take it out — and shrinking it without removing it is what you would expect from a fix that improved control rather than addressed the cause.
Along the runway: it depends entirely on the length of the final
Of 145 touchdowns, 47 reached the paved surface, up from 18 on the same starts. The median still lands 166 m short of the aim point, with the middle half falling between 194 m short and 8 m past it. But that single median hides the finding, because the behaviour splits hard by how far out the approach began.
| Started | Median past the threshold | Reached the runway | Flared | Gave up |
|---|---|---|---|---|
| 1.5 nm | 0 m | 21 of 54 | 41 of 41 | 13 |
| 2.0 nm | −135 m | 17 of 54 | 43 of 50 | 4 |
| 2.5 nm | −163 m | 9 of 54 | 34 of 54 | 0 |
From 1.5 nm it lands on the threshold — median 0 m, and every single touchdown flared. From 2.5 nm it lands 163 m short, which is where the previous version landed from everywhere. The longer the final, the shorter the landing, and most of the short landings are flared. The aircraft is flying a path that is already low by the time there is anything to flare for, and the further out it starts the longer it has to get there. That is a glidepath problem on the long final, and it is the next thing being fixed.
The flare was the last finding. It is no longer the problem.
The previous version flared on 55 of 139 touchdowns. This one flares on 118 of 145 — and on every single one of the 41 touchdowns from 1.5 nm. Median sink across all touchdowns fell from 341 to 195 ft/min.
The gap between flaring and not is still stark, which is what tells you the flare itself is working when it fires: where the aircraft flares it arrives at a median 140 ft/min, and where it does not it hits at 452 ft/min, more than three times harder. Twelve touchdowns were hard enough to be recorded as such.
But most of the short landings are flared. It arrives low, flares correctly, and touches down on the grass before the threshold. That moves the open problem back up the approach, onto the vertical path on the long final — a different and more tractable question than the one this page carried a day ago.
It does not matter whether it has seen the airfield
One of the three runway ends was part of what the system learned from. The other two were deliberately kept out. If it were memorising airfields rather than flying approaches, that would show here. It does not — the trained runway is not better on any measure, and the held-out field that improved most between the two versions, Kuala Terengganu, went from 3 touchdowns on the runway to 17.
| Runway end | Learned from | Reached the runway | On the aim point | Gave up | Median miss |
|---|---|---|---|---|---|
| Seletar 03 | trained | 17 | 2 | 4 | 164 m |
| Kuantan 18 | held out | 13 | 3 | 4 | 166 m |
| Kuala Terengganu 04 | held out | 17 | 5 | 9 | 167 m |
Three airfields is not a generalisation claim, and it is not offered as one. It is a negative result that matters: whatever is causing the short landings, unfamiliarity with the airfield is not it.
Put it in an aeroplane it has never flown
Until this week the only honest thing this page could say about other aircraft types was that nothing was known. Something is now known. The short version is that it does not transfer — but the reason is more useful than the headline, and a good part of it is not the system's fault.
Eleven types flew the same approach: centred, on the glidepath, from 2 nm, once at each of the three runway ends, in the same 8 kt crosswind. 33 approaches. Only the flight dynamics changed — what the aircraft sees out of the window is identical. The types run from a 50 kt Sopwith Camel to a 120 kt business jet. The system has only ever flown a 65 kt Cessna 172.
The caveat has to come first, because without it these numbers mislead. The inner loops that hold speed, glidepath, flare and go-around are tuned for a 65 kt Cessna 172, and were not retuned for any of these types. So this tests the whole stack on an unfamiliar aeroplane, control loops included. To isolate the vision and decision part, the human-written reference controller — the same one used elsewhere on this page — flew the identical 33 approaches through the identical loops.
| Type | Approach kt | Reference | This system | What it did |
|---|---|---|---|---|
| Cessna 172 (i) | 65 | 2 of 3 | 0 of 3 | touched down 162 m short to 3 m short |
| Cessna 172 (ii) | 65 | 0 of 3 | 2 of 3 | 5 and 27 m past the threshold; one went around |
| Cessna 172 (iii) | 65 | 0 of 3 | 0 of 3 | 82 to 196 m short |
| Cessna 182 | 70 | 2 of 3 | 1 of 3 | one landing 41 m past; two went around |
| Pilatus PC-7 | 90 | 3 of 3 | 2 of 3 | two long, one 151 m short |
| T-6 Texan II | 90 | 0 of 3 | 0 of 3 | 119, 129 and 131 m short |
| Piper J-3 Cub | 50 | 3 of 3 | 0 of 3 | landed long, 24–30 m off the side, all three |
| Sopwith Camel | 50 | 1 of 3 | 2 of 3 | 58 and 345 m past; one went around |
| Cessna T-37 | 100 | 1 of 3 | 0 of 3 | went around every time |
| Cessna 310 | 95 | 1 of 3 | 0 of 3 | went around, then lost control |
| Global 5000 | 120 | 2 of 3 | 0 of 3 | went around, then lost control |
| All 33 | — | 15 | 7 | on the runway |
“On the runway” means past the threshold and inside the 23 m half-width. Three different flight-dynamics models of the Cessna 172 were flown; they do not behave identically, which is itself worth knowing.
Half the ceiling is the rig, and half of what is left is real
The reference controller managed 15 of 33 through the same loops. That is the ceiling this rig imposes on an untuned type, and it is low. Against that ceiling the system managed 7 — about half as good as a controller that was written by hand and also never tuned for these aeroplanes.
Where the reference also fails, the system is not the limiting factor. Nothing landed the T-6: the reference put it 174 to 178 m short on every run, and the system actually did better, at 119 to 131 m short. Where the reference succeeds and the system does not, the finding is real — and there are two of those.
The Cub: a slow aeroplane in a crosswind
The reference landed the J-3 Cub on the runway all three times. The system put it 24 to 30 m left of the centreline on all three, just off the side, at all three airfields. At 50 kt the same 8 kt crosswind pushes an aeroplane much further than it does at 65 kt, and the corrections learned at 65 kt do not take it out. This is the clean version of the lateral bias reported further up this page: same direction, same cause, six times the size.
Every go-around gave a reason that was not the reason
13 of the 33 approaches went around, between 170 and 480 ft. Every one of them recorded the same cause: the runway was not in sight. In all 13, the runway had already been sighted on the approach.
So the decision to abandon is not being driven by whether the aircraft can see the runway. It is reacting to an approach that feels unfamiliar — a speed and a sink rate outside anything it has flown — and reporting the one reason it has available. The behaviour is arguably correct; giving up on an aeroplane you cannot fly is the right call. The explanation it gives for doing so is wrong, and that is the part that matters. It is the same failure as the navigation system that got lost and did not know it: the system's account of its own behaviour did not match what it actually had.
What the rig could not do
The Cessna 310 and the Global 5000 lost control after going around — a recovery loop built for a 65 kt single cannot fly a 95 kt twin or a 120 kt jet. Those rows are a rig limit, not a result. Of 39 types screened with the reference controller, only these 11 could be flown through the C172 loops at all; the rest landed far short, drifted off the side, floated, or could not be loaded. Per-type tuning comes before any of them mean anything.
Read together: the lateral behaviour transfers wherever the approach speed is near what it learned, and almost nothing survives a large change in speed — the Cub fails laterally for a reason that is really about speed. And the go-around trigger needs to be grounded in what the aircraft can actually see. None of that is visible from 162 approaches in one aeroplane, which is the argument for flying the ugly experiment.
Two much smaller models, on the identical 162 starts
A measured envelope is only worth the trouble if it can also tell you the system is not worth its size. Two lightweight baselines were trained and flown through the same 162 starts, scored the same way, on the same three runway ends. One of them reaches the runway more often than the system this page is about.
| Model | Reached the runway | On the aim point | Gave up | Median from the aim point |
|---|---|---|---|---|
| The system on this page | 47 | 10 | 17 | 166 m |
| Behaviour cloning | 36 | 9 | 19 | 138 m |
| Reinforcement learning, from scratch | failed the entry gate — never flown the matrix | |||
| Reinforcement learning, from a cloned start | 60 | 12 | 24 | 78 m |
Of 162 starts each. Distance is from the centre of the aim-point marking. The entry gate: fly the 9 centred starts first, and unless 5 of 9 touch down within 250 m of the aim point, the full matrix is not flown.
The small one is not worse, and the smallest one is better
A behaviour-cloned network of 153,397 parameters, trained in 48 seconds, reaches the runway 36 times against the system’s 47 — and when it does touch down it lands closer to the aim point, a median of 138 m against 166 m. The reinforcement-learning policy started from a cloned network does better still: 60 of 162 on the runway, 37%, against 29%, with a median of 78 m. It also gives up more often — 24 go-arounds against 17 — which is part of how it gets there.
Offline, on 2,915 held-out evaluation states, the small cloned network matches or beats the large system on six of the seven decisions it is asked for, including both of the ones that place the aircraft along and across the runway. The one it loses is which way to turn, and it loses it by a percentage point.
The reinforcement learning contributed nothing
This is the part worth reading twice, because the table above could otherwise be read as a win for RL.
- From scratch, it failed outright. 12.6 million decisions flown against a landing reward, and the best checkpoint in all of it put 0 of 9 centred starts within 250 m of the aim point. It never earned the right to fly the matrix and its column is empty on purpose.
- From a cloned start, the kept policy is the one before any RL at all. 8.0 million decisions were flown, and the checkpoint that validated best was the one at 0 reinforcement-learning steps — the cloned network as it stood before training began.
So the row that beats the system on this page is not a reinforcement-learning result. It is a second behaviour-cloned network, differing from the first only in shape and in how it was cloned, and the 8 million decisions flown after it produced nothing worth keeping. Both RL runs are reported here as what they are: one failure, and one success that belongs to the cloning.
| Model | Parameters | Trained on | Training time | Decision time |
|---|---|---|---|---|
| The system on this page | — | — | — | ~209 ms |
| Behaviour cloning | 153,397 | 101,158 expert-labelled states | 48 seconds | ~1 ms |
| RL, from scratch | 149,779 | no labels — 12.6 million decisions flown against a landing reward | 180 min | ~2 ms |
| RL, from a cloned start | 149,779 | the same 101,158 states, then 8.0 million decisions flown | 160 min | ~2 ms |
Both baselines are small feed-forward networks. The system’s own learner, size and training are not described here, for the same reason nothing else on this page describes a method; its decision time is a measured property of the deployed thing and is. Two orders of magnitude separate it from the baselines on that one measure — and the matrix does not pay it back.
What this does and does not say
- It does not say the small models are better. It says that on this matrix, as scored, the large system is not ahead — and that is a result about the measurement as much as about the models.
- Both baselines learned from the same teacher. They were cloned from the same 101,158 expert-labelled states the system was trained on, so none of this is evidence that they would generalise where it does. The held-out runway ends are the only test here that touches that.
- They were flown on the approach only. Nothing here says what either baseline would do on anything else.
- One attempt per start, as everywhere on this page. A 36-against-47 gap on 162 starts is suggestive, not decisive.
The useful finding is not which model won. It is that a 48-second baseline was close enough to make the question worth asking, and nothing but the measured matrix would have asked it. That is the argument this whole page exists to make, arriving from an uncomfortable direction.
Then all three were asked to land on a ship
This page used to list a carrier landing as the hardest future version of the question. It has now been tried — 400 approaches per model, 100 in each of four wind conditions, against a scripted reference pilot flying the identical scenarios. All three failed, and the margin is the result.
| Calm | 8 kt from the right | 8 kt from the left | 15 kt headwind | All 400 | |
|---|---|---|---|---|---|
| Scripted reference pilot | 78 | 78 | 75 | 49 | 280 |
| The system on this page | 10 | 6 | 0 | 9 | 25 |
| Behaviour cloning | 5 | 9 | 0 | 1 | 15 |
| RL, from a cloned start | 4 | 0 | 0 | 3 | 7 |
The reference pilot is a hand-written controller, not a learned one, flown on the same scenarios as a yardstick. The reinforcement-learning policy that never passed the runway entry gate was not flown here either.
The best of them puts 10 approaches of 100 on the deck in calm air. The scripted reference puts 78. Across all four conditions it is 25 of 400 against 280 — and the two baselines are worse, at 15 of 400 and 7 of 400. None of this is a near miss.
Three things in the detail are worth more than the totals
- An 8 kt crosswind from the left stops all three completely. 300 approaches between them, nothing on the deck. The same crosswind from the right leaves the system with 6 and the cloned network with 9. A left-right asymmetry that large is not a flying problem, it is a sign of something one-sided in how the approach is set up.
- They fail in different ways, and the ways are informative. The system floats past the wires — 53 bolters per 100 in calm, 56 in a right crosswind. The two small models mostly refuse instead: 52 go-arounds per 100 for the cloned network in calm, and 96 times in 100 for the RL-initialised one in a right crosswind. One arrives and cannot stop; the others arrive and will not commit.
- The 15 kt headwind column should be read with care. The reference pilot put 42 of its 100 approaches into the sea in that condition. When the yardstick itself fails two times in five, nothing measured against it there means much. The column is published anyway, with that said.
Of the 25 the system did get down, the median stopped 40 m past the wire in calm against the reference pilot’s 12 m, so even the successes are long — the same direction as the float that produces the bolters.
What it changes: the runway envelope on this page is unaffected, and the carrier result does not qualify it. What it removes is the option of implying the one leads to the other. A system that lines up to 4.2 m on a runway lands on a deck one time in ten at best, and the honest version of “what gets taken away next” now has a measured number attached to its hardest case instead of an ambition.
One weather condition, 162 times
Flying on what the aircraft can see makes weather a hard boundary rather than a nuisance variable — which is exactly why it is worth saying that this page does not have a weather envelope. Every approach in the matrix was flown in the same conditions, so nothing here establishes where the weather stops the landing.
Daylight, scattered cloud, 10–15 km visibility, and a steady 8 kt crosswind from the right at every one of the 162 starts, both versions. So nothing on this page is a calm-air result — and nothing on it is a bad-weather result either. One condition, 162 times.
What the weather does to this system has been measured on the navigation side. Low sun halves how often the aircraft can place itself, and broken cloud has defeated it outright — both found on en-route flights and both reported on the navigation page, together with the altitude and gust limits. Those are limits on knowing where you are. The equivalent for the approach — the same 162 starts re-flown in weather that degrades — has not been done, and until it is, the envelope on this page is a fair-weather envelope.
The test article
Four things — and the one that matters most is which of them the decisions were actually made on.
- Aircraft
- Cessna 172, 65 kt approach speed. Flaps and power handled by the aircraft’s own systems.
- Environment
- A commercial flight simulator over photographic satellite imagery of real terrain, with modelled wind and turbulence.
- Compute
- A standalone embedded module — a Jetson — receiving the out-the-window view over a local link.
- Airfields
- Three civil runway ends. Seletar 03 learned from; Kuantan 18 and Kuala Terengganu 04 held out.
It ran on a box that could fly
Everything above was produced with the decisions being made on a standalone embedded module — a Jetson, the class of hardware that would actually be bolted into an airframe. It answered in about half a second per decision, which is inside the budget an approach needs, and it made 34,427 of them across the campaign — a median of 228 per approach — over 6 hours and 8 minutes, 162 approaches and three airfields.
That matters more than the accuracy numbers do. A result that only exists on a workstation is a result about a workstation. This one has already survived the move to hardware that could be carried.
It was not an unattended run, and the earlier claim on this page that it was has been withdrawn. The simulator host needed two interventions: a launch that died seven minutes in and had to be restarted, and a window that opened over the simulator late in the run and was cleared in about twenty seconds. Both were the Windows machine driving the simulation. Neither was the decision box, which ran the whole campaign without a restart — but the distinction only counts for something if the failures are reported too.
How these numbers are counted
The figures above are worth what the counting behind them is worth.
- Every start is reported. 162 planned, 162 flown, 162 scored, for each of the two versions. Nothing was re-flown for a better result and no approach was dropped.
- The two versions are compared on identical starts. Same 162 cells, same crosswind, same scoring, same decision box. The older version was re-scored on this matrix, so no comparison on this page is between different sets of flights.
- One attempt each. A go-around ends the approach and counts as a failure to recover, with no retries.
- Scored against a published datum, not a judgement call: distance from the standard aim-point marking 21 m past the threshold, plus error from the centreline and sink rate at touchdown.
- Errors applied one axis at a time, so each outcome traces to one specific error.
- Trends, not cells. Each combination was flown once per airfield, which supports the shape of the envelope but not a failure rate for any individual cell. Repeats at the boundary are outstanding.
- Invalid runs declared, not deleted — see the two excluded weather flights above, and the two simulator-host interventions recorded under the hardware.
- Trained and held-out airfields reported separately, never blended into one number.
What this is not
- Flight status
- Simulation only. Nothing here has flown on an aircraft. A commercial flight simulator over photographic satellite imagery of real terrain, with modelled wind and turbulence.
- Not yet a camera
- The embedded module receives the simulator's out-the-window view over a local link, not a real camera feed. Lens, exposure, vibration and motion blur are all still ahead.
- Aircraft
- Cessna 172. One airframe type, one weight, flaps and power handled by the aircraft's own systems. Every figure above except the airframe tour is a Cessna 172. It does not transfer to other types — 7 landings on the runway out of 33 across eleven aeroplanes, against 15 for a hand-written reference controller through the same untuned loops. Nothing here claims otherwise.
- Position truth
- Error is measured against simulator truth, not a surveyed ground reference.
- Known optimism
- The reference imagery and the imagery flown come from the same source, which makes recognising places easier than reality will.
- Sample size
- Three runway ends, one flight per cell. Enough to show the envelope's shape, to rule out airfield familiarity, and to compare two versions on identical starts; not enough to quote rates.
- Provenance
- Personal project, personal hardware, personal time. Public imagery and published airport data. No employer data, systems or material.
Method, architecture and implementation are deliberately not described on this page.
The campaign now flying
This page is a snapshot of a programme that is still running. The current campaign has one hypothesis and one measure of success, and both are stated here before the result is known, so that the result cannot be chosen after the fact.
Most of the short landings are flared: the aircraft arrives low, flares correctly, and touches down on the grass before the threshold. From 1.5 nm it lands on the threshold; from 2.5 nm it lands 163 m short, and the longer the final the shorter the landing. Hypothesis: the vertical path is established low, and the resulting error is proportional to the length of the final — so this is a glidepath acquisition problem, not a control problem. Measure of success: the 2.5 nm column, on the identical 162 starts, re-scored on the same decision box.
All 13 go-arounds in the airframe tour reported a cause that was not the cause — the aircraft gave up for a defensible reason and then explained itself wrongly. That is not a reporting nicety: a system whose account of its own behaviour cannot be trusted cannot be certified against, however good its numbers are. The navigation side has the same fault in a starker form, where a lost aircraft kept flying the plan with its own confidence estimate reading kilometres. Making this system declare its own loss of integrity sits ahead of further accuracy work on both.
Every cell in the envelope was flown once per airfield. That supports the shape of the envelope but not a failure rate for any individual cell. Repeats at the 300 and 400 m offsets, where the strain shows, are the cheapest remaining improvement to the strength of every number on this page.
Training is continuing, so the figures above will move. Each campaign is re-flown on the same 162 starts and scored the same way, and no earlier number is removed when a better one arrives.
What gets taken away next
Everything on this page assumes a cooperative runway, seen in daylight, that holds still. Those are three separate assumptions, and each can be removed on its own and measured the same way — which is the axis this work runs along. The constraints at the top of the page say what was taken away to get these numbers; this says what gets taken away next. The order is by how far the current evidence carries.
| Assumption removed | What the problem becomes | What the current evidence is worth there |
|---|---|---|
| Daylight | Approach on an infrared or low-light sensor | Most of it. The geometry is unchanged and the system is already vision-only. The low-sun degradation reported under the weather limits is the same failure in a milder form, and its cause there was mundane — midday reference imagery, so the shadows did not match. |
| A marked, cooperative runway | Approach to an unprepared strip — no threshold, no centreline, no paved edge | Least of it, and this is the most interesting of the three. The current system leans on exactly the visual structure an unprepared strip does not have. The lateral result — the one thing this campaign solved — should be expected to fail first. |
| A runway that holds still | Recovery to a moving deck | Almost none of it — and that is now measured, not predicted. It was flown: 25 deck landings in 400 against a scripted reference pilot’s 280, and nothing at all in a left crosswind. The reasoning below was right for the right reason — deck recoveries are deliberately un-flared, so this campaign’s headline result does not transfer. The numbers are above. |
Two of the three have not been flown, and nothing on this page should be read as evidence about either. The third has, and it failed by the margin reported above — which is the useful thing about writing the row down before flying it: the prediction and the result can be read side by side, and here they agree. They are listed because the assumption each one removes is already named in the constraints at the top, and because a test programme that cannot say what it would do next is not a programme.